
Introduction to Bivariate Data
Introduction to Bivariate Data: Overview
This topic covers concepts, such as, Independent Variable, Dependent Variable, Scatter Diagrams, Line of Best Fit, Bivariate Data & Strength of Relationship of Scatter Diagrams etc.
Important Questions on Introduction to Bivariate Data
Scatter diagram does not help us to
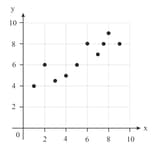
For the given data, Describe the type of correlation.
Decide which of these statements best represents the relationship between scatter plot
Decide which of these statements best represents the relationship between scatter plot
List the differences between univariate and bivariate data.
Define bivariate data.
The data graphed on axis is known as _____ variable.
Determine the equation of line of best fit for the data:
Shawn is buying boxes of cookies at a bakery. Each box of cookies costs .
Which of the following statement is true?
Emma is conducting a survey into the masses of dogs and during their morning walk in minutes. She presents the results in the table below.
| Duration of walks (min) | ||||||||||
| Mass (kg) |
Draw a scatter diagram to show the mass of each dog against the duration of the morning walk in minutes. (Plot the mass of the dog on the vertical axis.)
Mr. Bobby is investigating the relationship between the number of sales assistants working in a department store and the length of time (in seconds) he spends waiting in a queue to be served. His results are shown in the table below.
| Number of sales assistants | |||||||||||||
| Waiting time (seconds) |
Draw a scatter diagram to show the length of time Mr. Bobby spends queueing and the number of sales assistants working in the store. Describe the correlation between the number of sales assistants and the time spent queueing.
For two variables and it is known that cov variance of is and sum of squares of deviation of y from its mean is The number of observations for this bivariate data is
The table gives the height and weight of adult mountain zebras.
| Height x (m) |
1.37 | 1.17 | 1.2 | 1.34 | 1.42 | 1.42 | 1.37 | 1.48 | 1.51 | 1.23 | 1.57 | 1.29 | 1.30 | 1.44 |
| Weight y (kg) |
257 | 171 | 185 | 214 | 315 | 271 | 242 | 329 | 314 | 185 | 356 | 228 | 230 | 285 |
Draw a scatter diagram.
There are twelve year-old girls in an athletics club. The table shows their leg length and time to run .
| Leg length x (cm) |
82 | 91 | 85 | 93 | 86 | 95 | 70 | 87 | 90 | 75 | 91 | 80 |
| Time to run y (s) |
245 | 210 | 243 | 220 | 240 | 225 | 250 | 243 | 230 | 248 | 220 | 240 |
Draw a scatter diagram.
The table shows information on road deaths and vehicle ownership in ten countries.
Draw a scatter diagram with vehicles per population on the axis and road deaths per population on the axis.
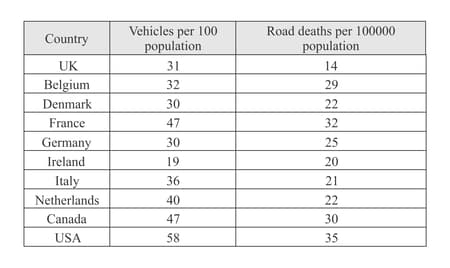
Does the graph show any correlation?
Consider the set of data points in the table. Plot these points on a scatter diagram.
The table shows the gross domestic product (GDP) and the average number of books read per person in a year for countries. Plot a scatter diagram for this data.
The table shows the area , in millions of square feet) of ten shopping malls, along with the annual number of visitors , in millions. Describe the correlation
The table shows the area (, in millions of square feet) of ten shopping malls, along with the annual number of visitors millions. Plot a scatter diagram for this data.
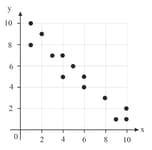
For the given data, Describe the type of correlation.


